Donny Bertucci
Currently working on predicting and exploring biology at Axiom Bio.
I've published machine learning research [_, _, _, _], applied machine
learning to biology [_, _, _], explored the internals of machine learning
architectures [_, _, _, _, _, _], and developed libraries to process large-scale data [_, _, _].
Fortunate to have been a member of the Carnegie Mellon Data Interaction Group (DIG), Oregon State Venom Biochemistry & Molecular Biology Lab, Oregon State Data Interaction and Visualization Lab, and Georgia Tech Visualization Lab.
Experience
PRESENT
Axiom Bio | axi.om, Engineer, Member of Technical Staff
Building interactive tools and ML/AI models to predict biology.
9.2023 – 6.2024
Georgia Institute of Technology | Visualization Lab, Graduate Research Assistant
Built interactive visualizations to interpret machine learning model architectures (such as VAE
and VQ-VAEs) [_, _, _, _] with Dr. Alex Endert.
9.2023 – 6.2024
Oregon State University | Venom Biochem Lab, Research Assistant
Led group to build a system to store, visualize, and search for similar venom protein structures
using computational methods [_]. Advised by Michael Youkhateh and Dr. Nathan Mortimer.
Carnegie Mellon University | Data Interaction Group, Research Assistant
Summer 2023
Researched interactive methods to improve language model prompt generation and transparency with Dr. Adam Perer. Developed interactive visualizations of neural network compression/quantization
error [_].
9.2022 – 6.2023
Cross-filtering for large-scale data with Falcon [_] with Dr. Dominik Moritz. Researched human-centered ways to evaluate Machine Learning model behavior within
Zeno [_] with Dr. Alex Cabrera.
Summer 2022
Carnegie Mellon HCII Summer Research Program: developed user interfaces to interactively discover poor behavior in neural networks [_]. Advised by Dr. Alex Cabrera and Dr. Adam Perer. Program led by Dr. Laura Dabbish.
Oregon State University | Data Interaction and Visualization Lab, Research Assistant
8.2021 – 5.2022
Developed user interfaces to visualize large data and interpret complex machine learning models [_, _]. Published to ICAPS and IEEE VIS. Mentored and
advised by Dr. Minsuk Kahng.
Summer 2021
EECS Summer Research Cohort to improve research presentation skills mentored by Dr. Alan Fern, Dr. Yue Cao , Dr. David Hendrix, and Dr. Patrick Donnelly.
2.2021 – 6.2021
URSA Engage Undergraduate Research Program: developed interactive interfaces to visualize difficult concepts in learned neural networks and
published to VISxAI workshop [_, _]. Advised by Dr. Minsuk Kahng.
Education
8.2024 – 11.2024
Ph.D. Computer Science (incomplete)
Georgia Institute of Technology9.2020 – 6.2024
B.S. Computer Science
Oregon State UniversitySkills
- Languages Python, Javascript/Typescript, C/C++, Matlab, R, Mathematica, Bash.
- ML/AI PyTorch, Jax, TensorFlow, Keras, Scikit-learn, NumPy, CUDA.
- Bio/Neuro ChimeraX, Mol*, BioPython, NiBabel, FSL.
- Frontend Figma, HTML, CSS, Svelte, React, Vue, Tailwind.
- Backend Pandas, FastAPI, Flask, NodeJS, MySQL, DuckDB, PostgreSQL, Assembly.
- OS Linux, Git, SSH, FTP, NGINX, Apache, Docker.
- HPC Slurm, CUDA, OpenCL, OpenMP, MPI.
- Data Vis D3, SVG, Canvas, WebGPU, Vega, Matplotlib, Seaborn, Altair.
- Research LaTeX, Figure Design, Statistical Analysis.
- Relevant Coursework Machine Learning, Artificial Intelligence, Parallel Programming, Molecular Modeling, Animal Genetics, Human Behavioral Biology, Discrete Math, Linear Algebra I & II, Numerical Linear Algebra, Non Euclidean Geometry, Differential Calculus, Integral Calculus, Vector Calculus, Mathematical Statistics I & II.
Publications
Conference
C3
Zeno: An Interactive Framework for Behavioral Evaluation of Machine Learning
Alex Cabrera, Erica Fu, Donald Bertucci, Kenneth Holstein, Ameet Talwalkar, Jason I. Hong, and Adam Perer
ACM Conference on Human Factors in Computing Systems (CHI). Hamburg, Germany, 2023.
C2
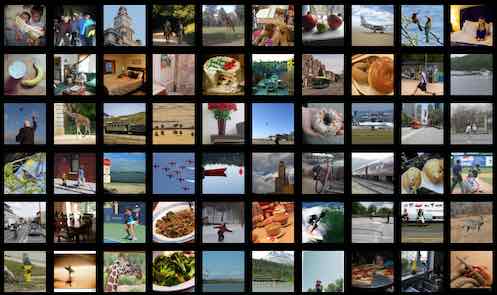
DendroMap: Visual Exploration of Large-Scale Image Datasets for Machine Learning with Treemaps
Donald Bertucci, Md Montaser Hamid, Yashwanthi Anand, Anita Ruangrotsakun, Delyar Tabatabai, Melissa Perez, and Minsuk Kahng
IEEE Transactions on Visualization and Computer Graphics (IEEE VIS 2022). Oklahoma City, OK
C1
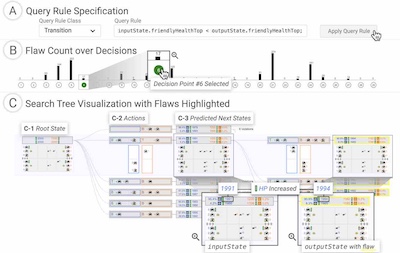
Beyond Value: CHECKLIST for Testing Inferences in Planning-Based Reinforcement Learning
Kin-Ho Lam, Delyar Tabatabai, Jed Irvine, Donald Bertucci, Anita Ruangrotsakun, Minsuk Kahng, and Alan Fern
32nd International Conference on Automated Planning and Scheduling (ICAPS 2022).
Workshop
W4
Venome: A Computational Analysis Tool for Protein Function
2024 Engineering Expo, Oregon State University. Corvallis, OR
W3
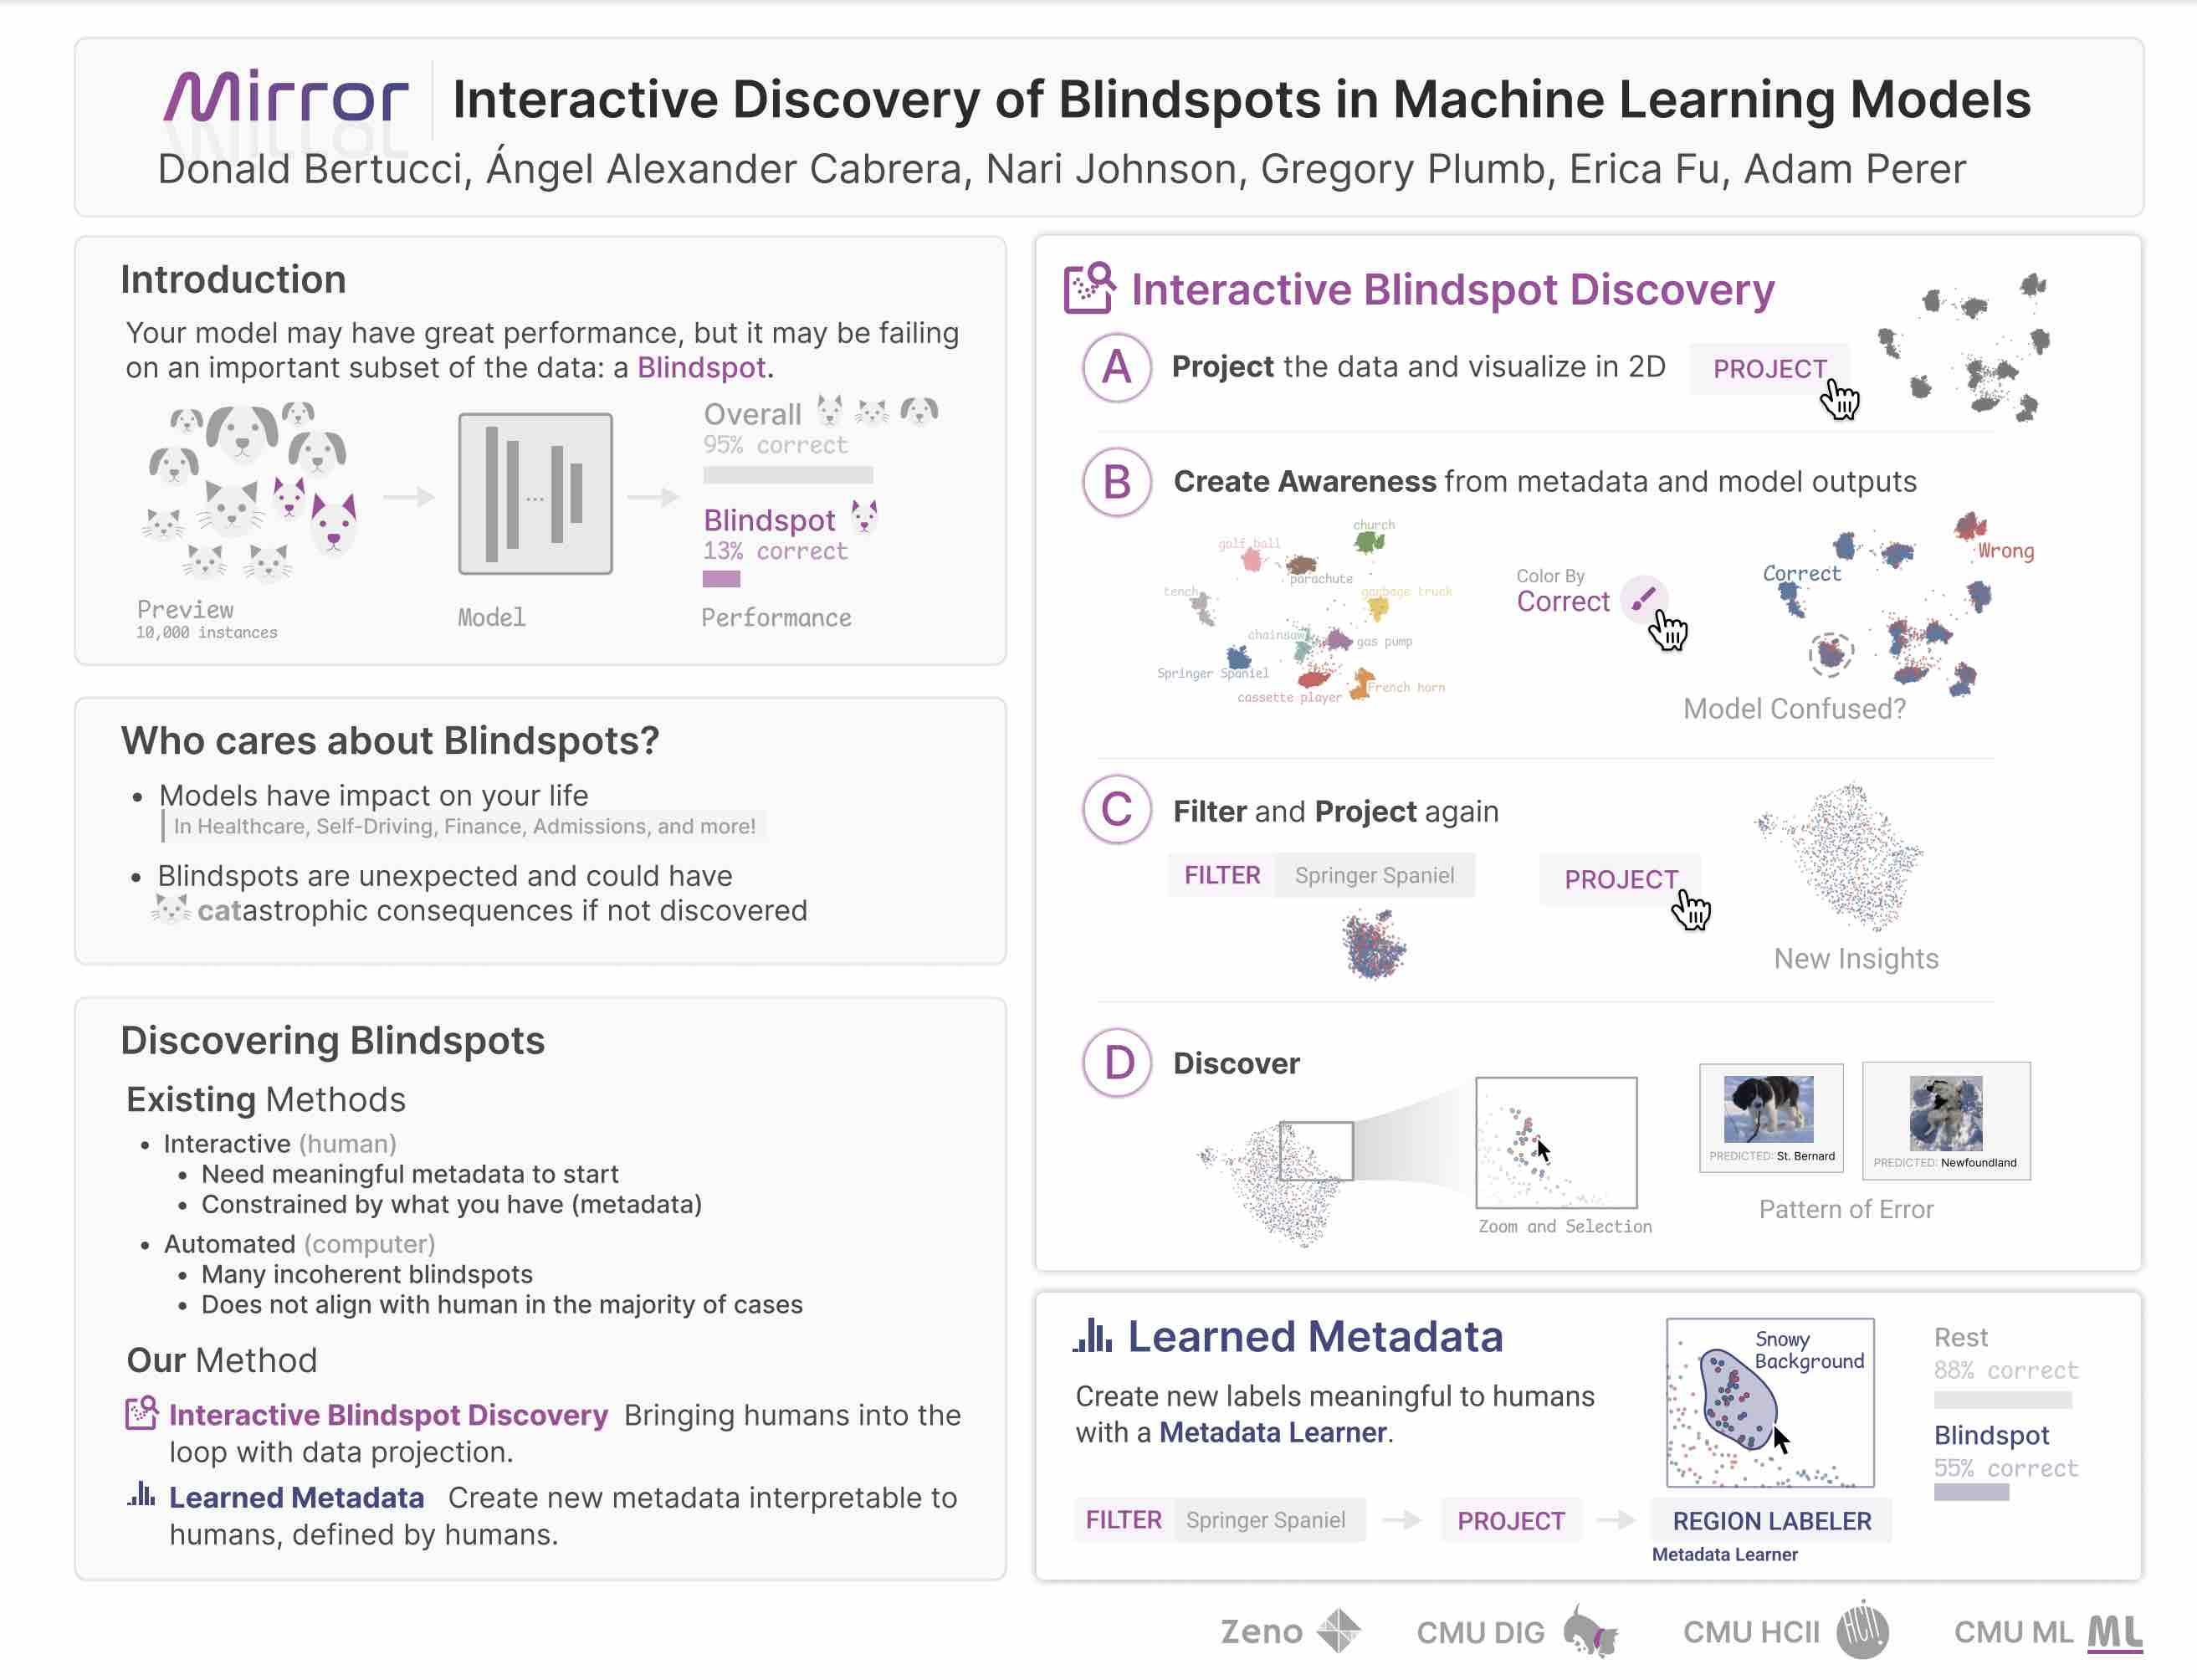
Mirror: Interactive Discovery of Blindspots in Machine Learning Models
Human-Computer Interaction Institute (HCII) Summer Research Showcase (2022). Pittsburgh, PA
W2
Backprop Explainer: Interactive Explanation of Backpropagation in Neural Network Training
Workshop on Visualization for AI Explainability (VISxAI, IEEE VIS 2021).
W1
An Interactive Introduction to Autoencoders
Workshop on Visualization for AI Explainability (VISxAI, IEEE VIS 2021).
Miscellaneous
M8
VQ-VAE Explainer: Learn the VQ-VAE Implementation with Interactive Visualization
Interact with and visualize a VQ-VAE (Vector-Quantized Variational Autoencoder) directly in the browser.
M7
Explore ARC-AGI
Visualize the ARC-AGI dataset with live crossfiltering for compression metrics.
M6
VAE Explainer: Supplement Learning Variational Autoencoders with Interactive Visualization
Interact with and visualize a Variational Autoencoder directly in the browser.
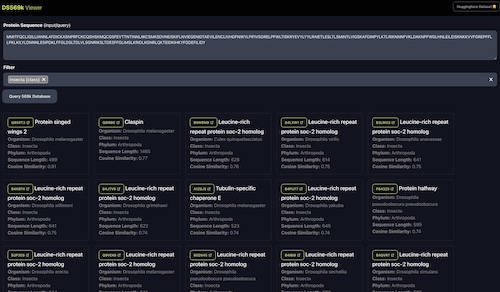
M5
DS569k: Protein Sequence and Function Joint Embeddings Dataset
Protein embeddings based on function (ProteinCLIP + ESM2) for ~569k proteins from UniprotKB. And web app to query similar proteins given a sequence.
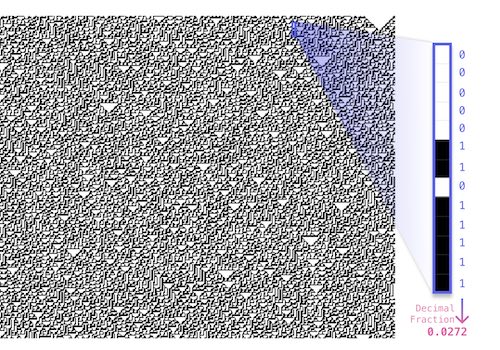
M4
Random Number Generator with Elementary Cellular Automata in Matlab
Random numbers with Elementary Cellular Automata Rule 30 in Matlab + transform to any other distribution.
Mathematical Software with Torrey Johnson, Oregon State University. Corvallis, OR
M3
ProteinScatter: Visualizing Structurally Similar Proteins with 3Di Embeddings
Trained a GPT-like model on 300+ thousand protein 3Di sequences (from Foldseek) and visualized embeddings in a 2D scatterplot via UMAP.
Molecular Modeling with Juan Vanegas, Oregon State University (2024). Corvallis, OR
M2
Visualizing Neural Network Compression
An interactive article exploring how model compression error affects neural network behavior.
M1
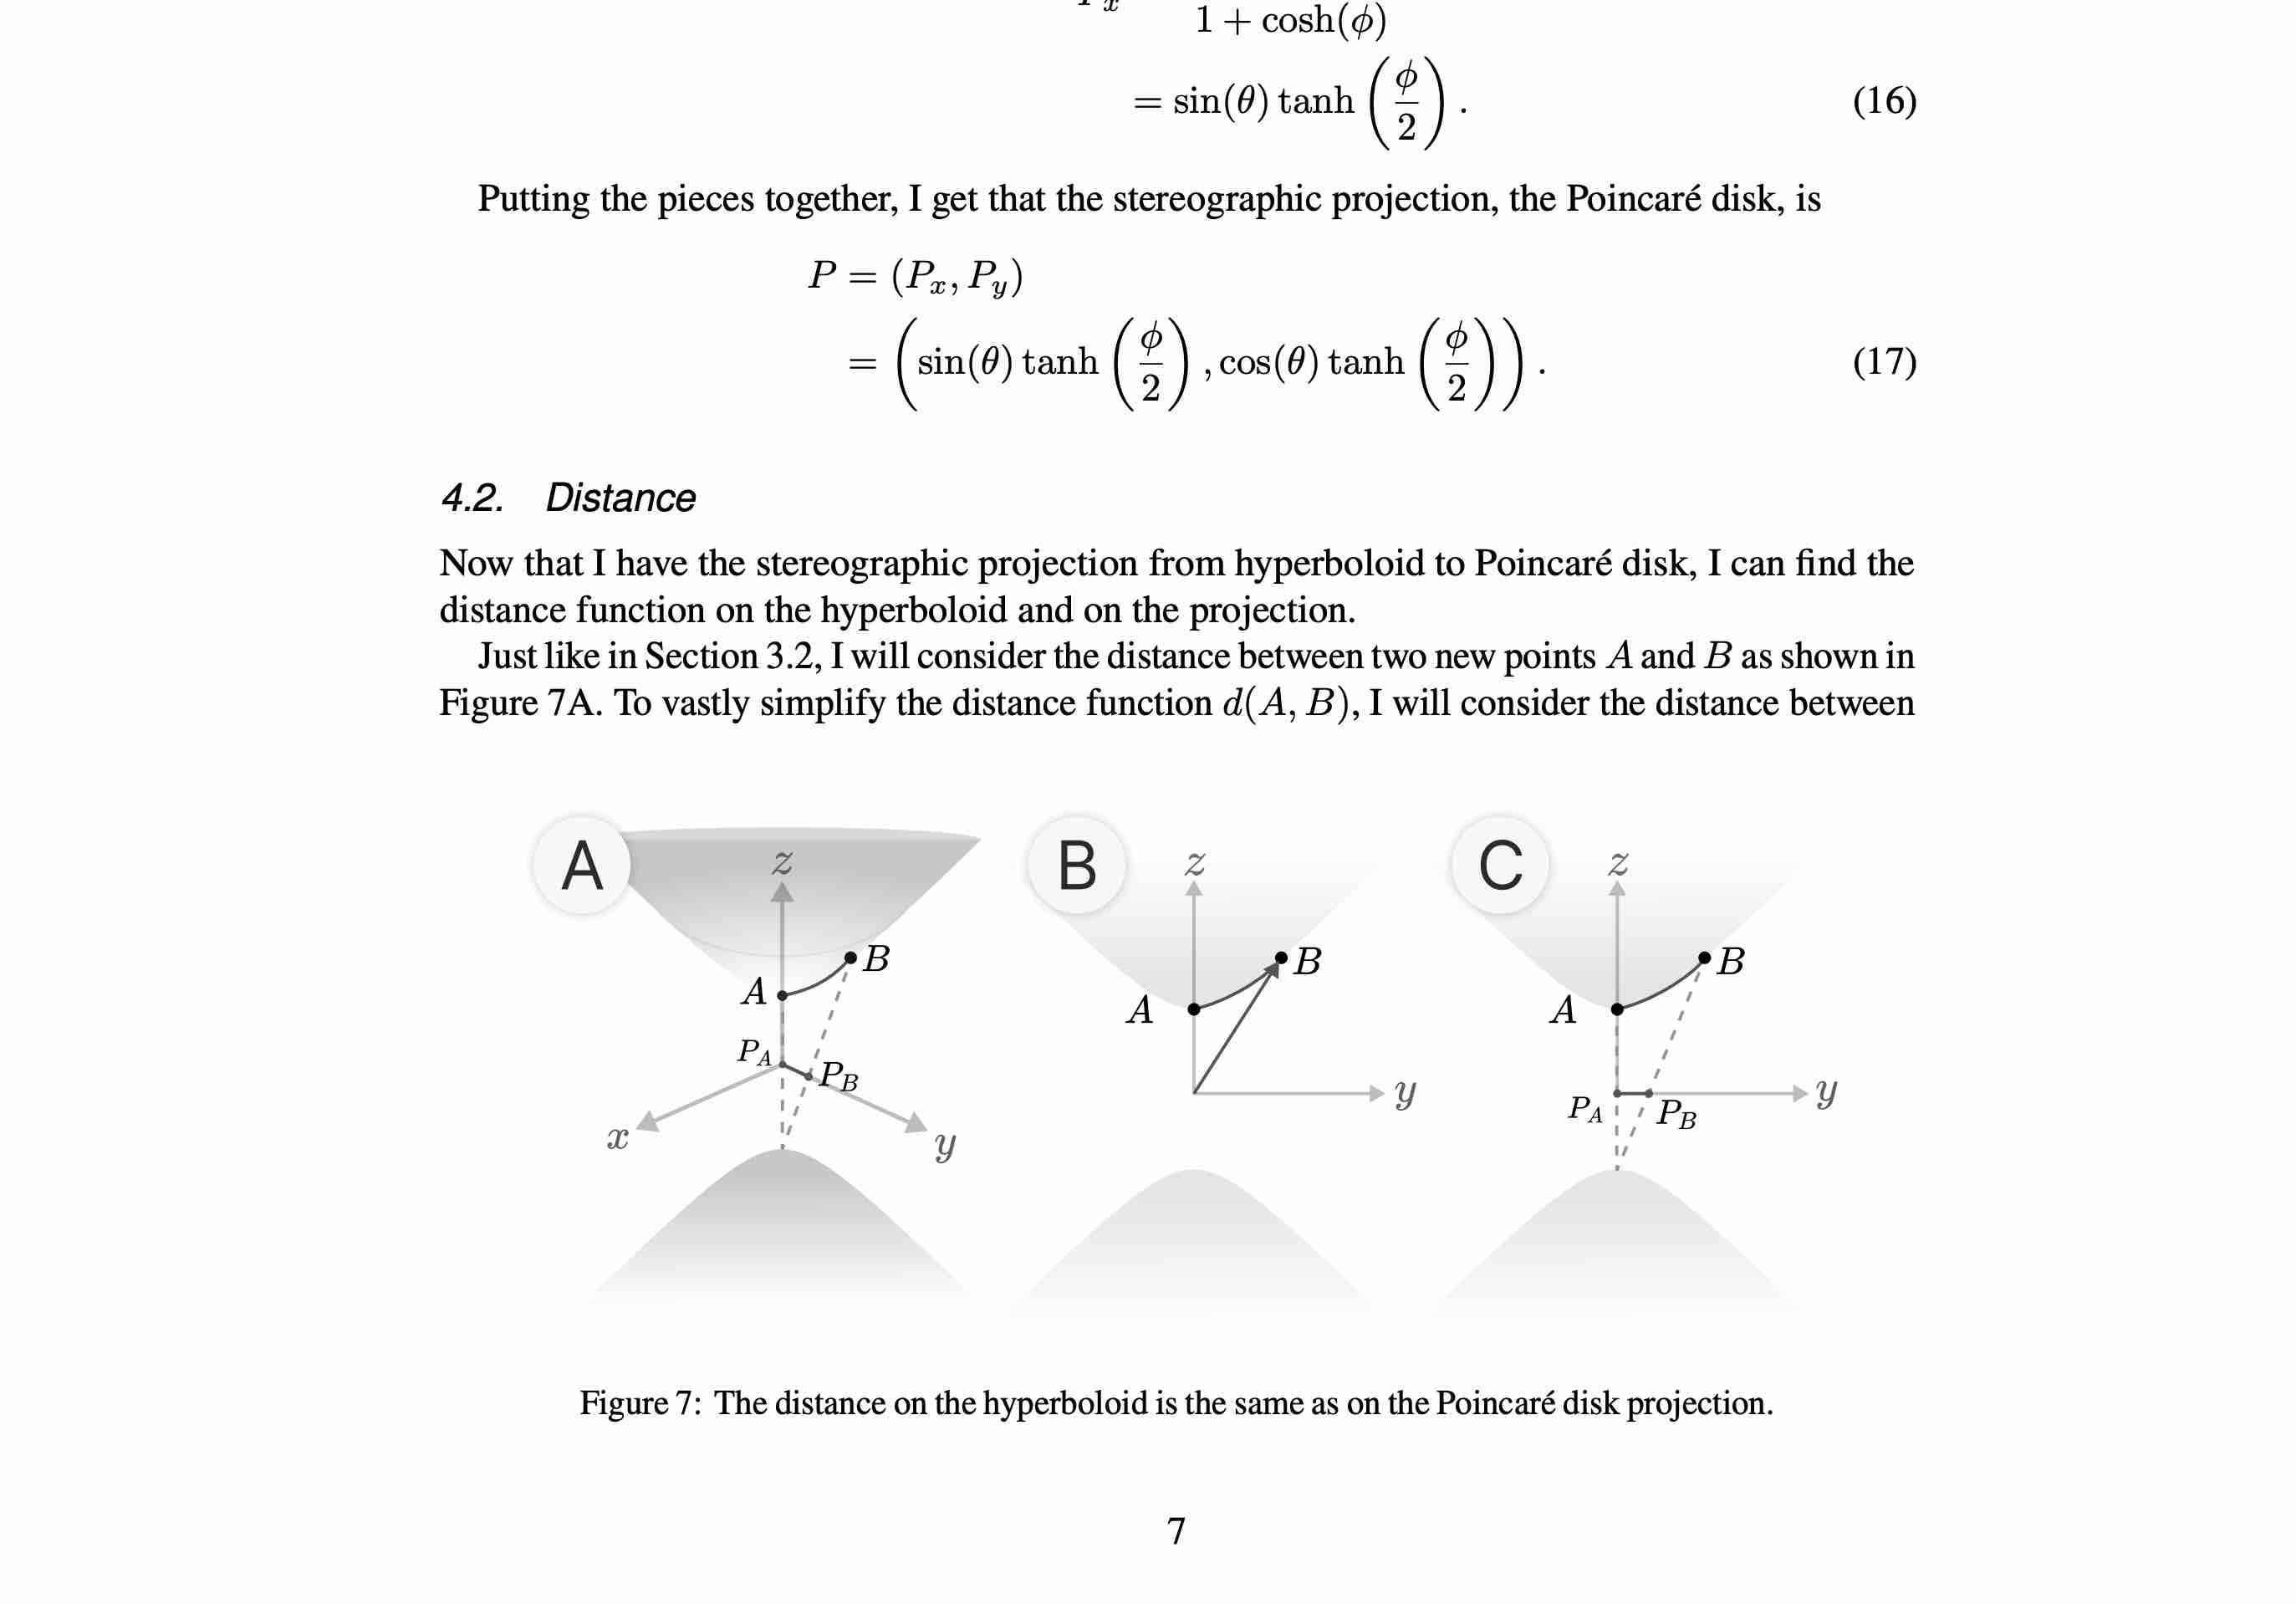
Finding the Distance Function in the Poincaré Disk using Stereographic Projection
A paper that derives the Poicare disk distance function using stereographic projection from Minkowski Space.
Non-Euclidean Geometry with Tevian Dray, Oregon State University (2023). Corvallis, OR
Software/Packages
S4
nsdget: Quickly use Single Trial Betas and COCO Images from the Natural Scenes Dataset
Python library to easily download and use the single trial betas (1.8mm res) and COCO images from the Natural Scenes Dataset.
S3
DeepLocalizer: A Library to Find Functional Specialization in Deep Neural Networks
Python library to find function specific activations in artificial neural networks using fMRI-like localization.

S2
TensorScript: Tensor Library accelerated by WebGPU
Tensor operations and auto differentiation with custom WebGPU kernels.
S1
FalconVis: A Library to Cross-Filter Billions of Data Entries on the Web
A JavaScript library for visualizing big data on the web with your custom visualizations and scalable data formats.
References
Dr. Minsuk Kahng
Computer Science Professor at Yonsei University
Dr. Alex Cabrera
Founding Engineer at Axiom Bio
Dr. Adam Perer
Computer Science Professor at Carnegie Mellon University HCII
Dr. Dominik Moritz
Computer Science Professor at Carnegie Mellon University HCII and Apple ML Research Scientist
Dr. Nathan Mortimer
Biochemistry Professor at Oregon State University
Dr. Alex Endert
Computer Science Professor at Georgia Institute of Technology